Overview of monitored wetland sites
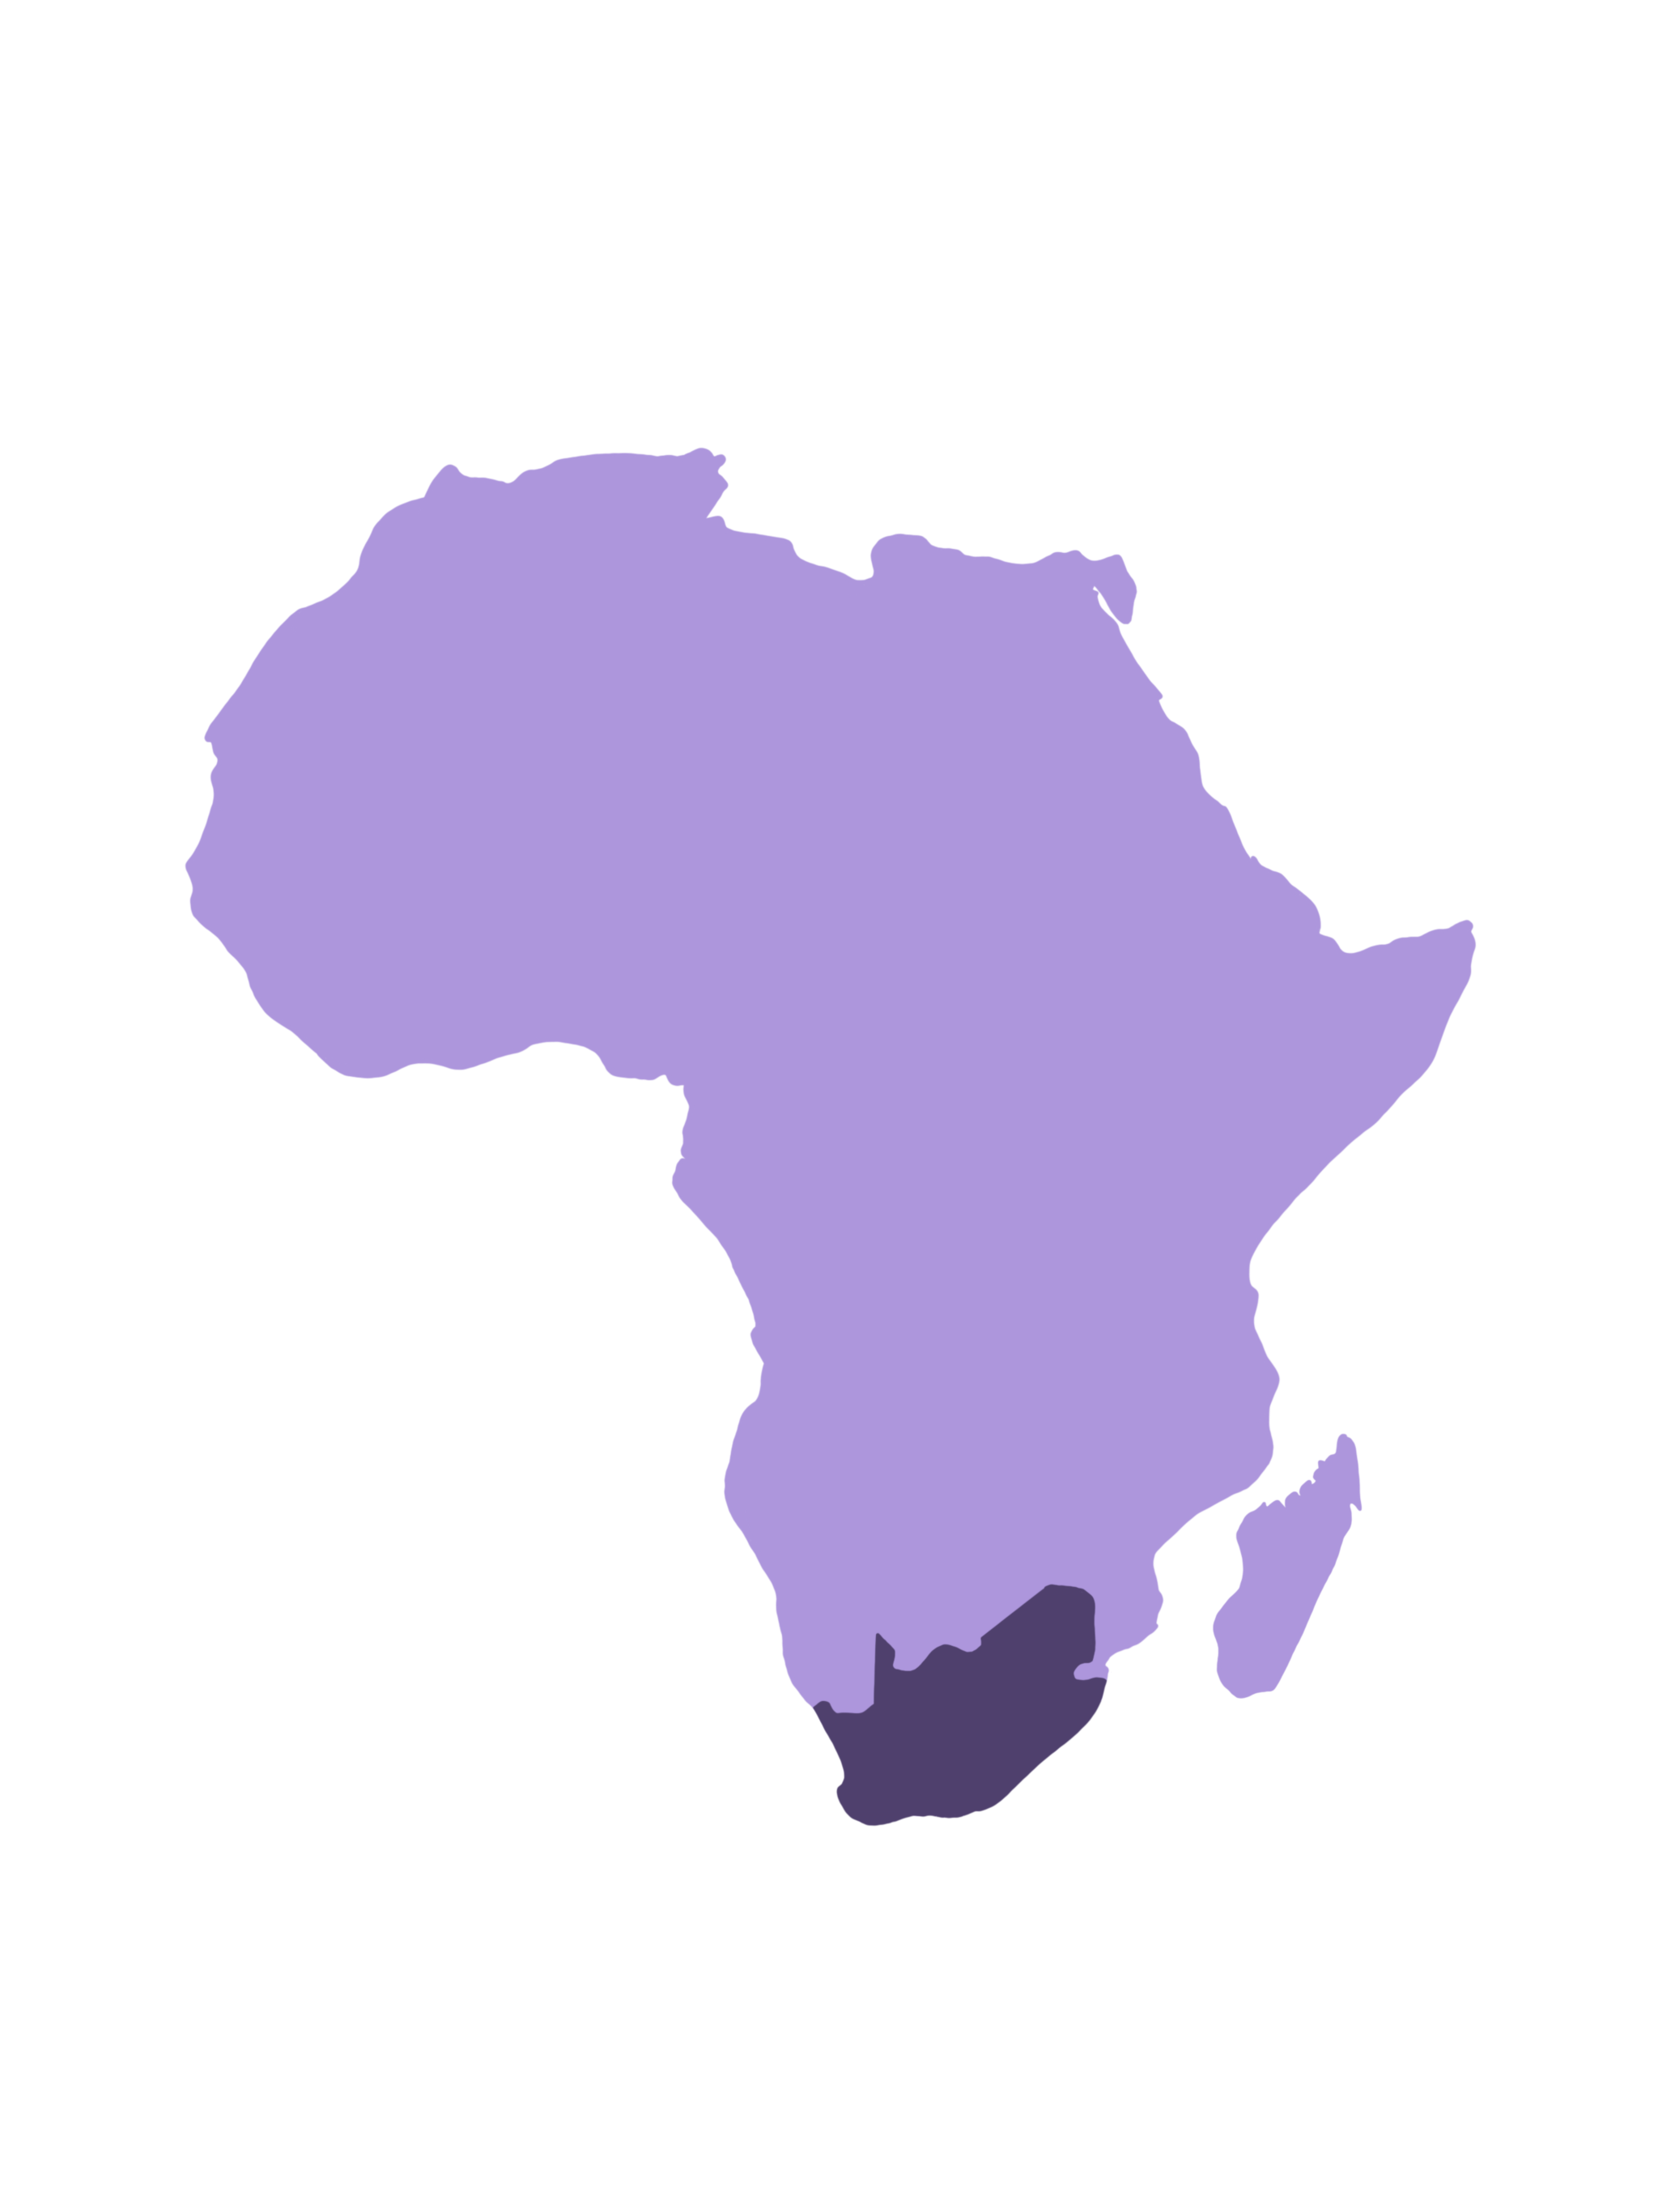
The Coordinated Waterbird Counts (CWAC) collects abundance data for waterbird species at 688 wetland sites across South Africa. Since 1992, counts have been done twice a year, in summer and winter, providing good long term records. The data are able to reveal trends in waterbird numbers at different sites. When viewing this with ancillary data, such as catchment area and management information, you can gain a comprehensive understanding of these crucial habitats and the trends affecting their health.
Vital statistics
| Total number of citizen science visits (CWAC sites) | Number of species in last year | List of threatened species detected in last year | Waterbird Conservation Value in last year (WCV) |
|---|
To note: We consider NT (Near Threatened), VU (Vulnerable), EN (Endangered), and CR (Critically Endangered) to be the categories that fall under the "threatened status".
Site level WCV categories
| Category | Range | Description |
|---|---|---|
| 1 | 0-10 | Low index - site may support threshold populations for a few species; conservation value is low |
| 2 | 11-24 | Medium index - site supports important threshold populations for some species; conservation value is medium |
| 3 | 25-49 | High index - site supports important threshold populations for numerous species; conservation value is high |
| 4 | 50+ | Very high index - site supports significant threshold populations for numerous species; conservation value is significant |
Site description
Wetland information
Bird information
For plots and tables showing changes in bird abundance at this site, open the Species page >>
Summary
Species level
Species level WCV categories
| Category | Range | Description |
|---|---|---|
| 1a | <0.5 | Species abundance does not meet 1% threshold; population has low conservation value |
| 1b | 0.5-0.99 | Species abundance does not meet 1% threshold but meets or surpasses sub-regional IBA level (0.5%); population has low-medium conservation value |
| 2 | 1.0 - 2.99 | Species abundance meets threshold or surpasses it by no more than three times; population has medium conservation value |
| 3 | 3.0 - 4.99 | Species abundance surpasses threshold three times but no more than five times; population has medium-high conservation value |
| 4 | 5.0 - 9.99 | Species abundance surpasses threshold five times or more but not more than 10 times; population has very high conservation value |
| 5 | ≥10.0 | Species abundance greatly surpasses threshold ten times or more; population has priority conservation value |


